on
Unleashing the power of Jira Control Charts for software teams
As someone who juggles multiple roles in a software team—engineering manager, Agile product owner, technical strategist, support engineer, and occasional author of Go and Terraform pull requests—I’ve found one tool to be invaluable: the Jira control chart.
After my Scrum team completes each two-week Sprint, I often spend some time to think about how incremental shifts in our processes and goals might have impacted the team’s efficiency and delivery. This is where the Jira control chart shines. It allows me to quickly identify opportunities for improvement and confirm any hunches I might have about bottlenecks. At one point, I suspected some friction in our day-to-day execution due to a process change outside of our immediate Scrum team. The control chart was exactly the right tool to quickly figure out when it started and how it was progressing. It gave me a data-driven confirmation of what I thought was happening, and assurance that continuing to prioritize improvements in that area would eliminate our bottleneck.
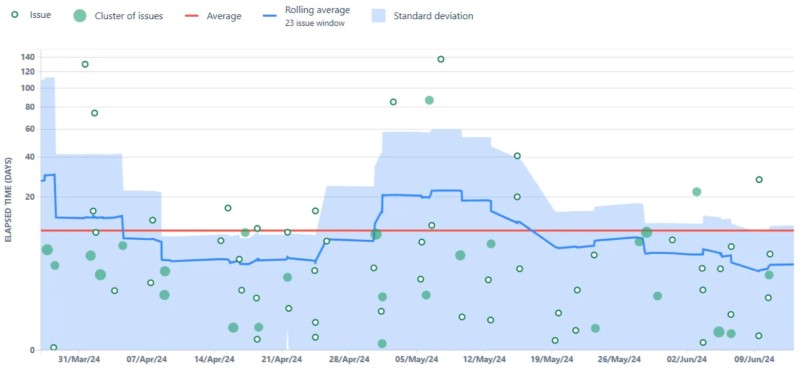
So, what exactly is a Jira control chart? Picture a straightforward graph where the horizontal axis represents time and the vertical axis shows the number of tasks completed. This visual representation lets us see whether our team is consistently hitting our targets or if we’re encountering some bumps along the way.
Here’s a generic example:

If there’s a bottleneck, it’ll show up as a noticeable dip in the line—a clear signal that progress has slowed. By diving into the data, we can uncover where tasks are getting stuck. For instance, if we see a backlog piling up in one area, it might indicate we need more thorough reviews or that technical hurdles are holding us back.
Recognizing these patterns allows us to focus our efforts where they matter most. Think of the control chart as a roadmap, guiding us to areas where we can enhance our processes and boost overall efficiency. If you haven’t explored Jira control charts yet, I highly recommend giving them a try. They can transform how your team identifies and tackles challenges, ultimately helping everyone thrive.